So I've bought MBP M1 Max 32 cores less last month. Since then I've been monitoring CPU & GPU usage and temperatures by iStat Menus. Until yesterday CPU usage rarely exceeded 8-10% (GPU even less, I'd say 3-5%) and temperatures showed 48-55 °C. To be honest, that is because I didn't run more demanding tasks lately (holidays).
In one day between yesterday and day before yesterday something strange happen (I moved 400km to another city that day if does it matters).
Since than the GPU usage constantly shows at least 20% (sometimes rises up even to 50%-60%+), while I doing nothing but having Safari opened. Closing Safari and every other app and doing literally nothing doesn't change anything. CPU usage rises up to 10-20% also, but this is much more understandable to me, however GPU has nothing to process at all.
I started to suspect that GPU usage isn't really 20-50% and maybe iStat Menus shows wrong. I thought so because I had noticed GPU temperature didn't really change (shows still 48-53%).
I checked by powermetrics and "sudo powermetrics | grep GPU" shows most often low GPU usage, sometimes rises up indeed, but never exceedes 9% (checked over 300 samples). Sample output below:
I also checked indications by Mx Power Gadget and despite GPU frequency rarely rises up, GPU utilization fluctuates constantly indeed:

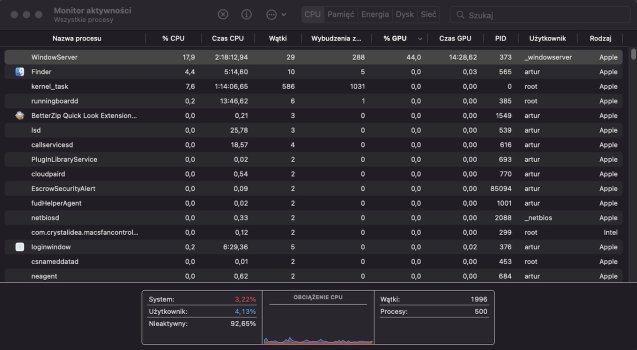
Finally I noticed that only one task in macOS Activity Monitor sometimes rises "% GPU" up and that is WindowsServer.
In conclusion one day CPU & GPU show one digit % in the idle, the very next day it's two digits 15% up to 50%. Does anybody have a clue what is going on here?
In one day between yesterday and day before yesterday something strange happen (I moved 400km to another city that day if does it matters).
Since than the GPU usage constantly shows at least 20% (sometimes rises up even to 50%-60%+), while I doing nothing but having Safari opened. Closing Safari and every other app and doing literally nothing doesn't change anything. CPU usage rises up to 10-20% also, but this is much more understandable to me, however GPU has nothing to process at all.
I started to suspect that GPU usage isn't really 20-50% and maybe iStat Menus shows wrong. I thought so because I had noticed GPU temperature didn't really change (shows still 48-53%).
I checked by powermetrics and "sudo powermetrics | grep GPU" shows most often low GPU usage, sometimes rises up indeed, but never exceedes 9% (checked over 300 samples). Sample output below:
Code:
*** GPU usage ****
GPU active frequency: 15 MHz
GPU active residency:   3.56% (389 MHz: 3.4% 486 MHz:   0% 648 MHz:   0% 778 MHz: .17% 972 MHz:   0% 1296 MHz:   0%)
GPU requested frequency: (389 MHz: 2.7% 486 MHz:   0% 648 MHz:   0% 778 MHz: .17% 972 MHz: .71% 1296 MHz:   0%)
GPU idle residency:  96.44%
GPU Power: 18 mW
com.apple.WebKit.GPU               714    0.69      37.58  0.00    0.00               0.98    0.00
GPU Power: 15 mW
**** GPU usage ****
GPU active frequency: 9 MHz
GPU active residency:   2.39% (389 MHz: 2.4% 486 MHz:   0% 648 MHz:   0% 778 MHz:   0% 972 MHz:   0% 1296 MHz:   0%)
GPU requested frequency: (389 MHz: 2.4% 486 MHz:   0% 648 MHz:   0% 778 MHz:   0% 972 MHz:   0% 1296 MHz:   0%)
GPU idle residency:  97.61%
GPU Power: 15 mW
com.apple.WebKit.GPU               714    0.62      40.58  0.00    0.00               0.00    0.00
GPU Power: 25 mW
**** GPU usage ****
GPU active frequency: 19 MHz
GPU active residency:   3.19% (389 MHz: 1.7% 486 MHz:   0% 648 MHz:   0% 778 MHz: 1.3% 972 MHz: .23% 1296 MHz:   0%)
GPU requested frequency: (389 MHz: 1.2% 486 MHz:   0% 648 MHz:   0% 778 MHz: 1.6% 972 MHz: .34% 1296 MHz:   0%)
GPU idle residency:  96.81%
GPU Power: 25 mW
com.apple.WebKit.GPU               714    0.72      39.01  0.00    0.00               0.00    0.00
GPU Power: 10 mW
**** GPU usage ****
GPU active frequency: 6 MHz
GPU active residency:   1.63% (389 MHz: 1.6% 486 MHz:   0% 648 MHz:   0% 778 MHz:   0% 972 MHz:   0% 1296 MHz:   0%)
GPU requested frequency: (389 MHz: 1.6% 486 MHz:   0% 648 MHz:   0% 778 MHz:   0% 972 MHz:   0% 1296 MHz:   0%)
GPU idle residency:  98.37%
GPU Power: 10 mW
com.apple.WebKit.GPU               714    0.58      42.15  0.00    0.00               0.00    0.00
GPU Power: 16 mW
I also checked indications by Mx Power Gadget and despite GPU frequency rarely rises up, GPU utilization fluctuates constantly indeed:
Finally I noticed that only one task in macOS Activity Monitor sometimes rises "% GPU" up and that is WindowsServer.
In conclusion one day CPU & GPU show one digit % in the idle, the very next day it's two digits 15% up to 50%. Does anybody have a clue what is going on here?