Become a MacRumors Supporter for $50/year with no ads, ability to filter front page stories, and private forums.

Outer_net

macrumors newbie
Original poster
Aug 6, 2021
28
6
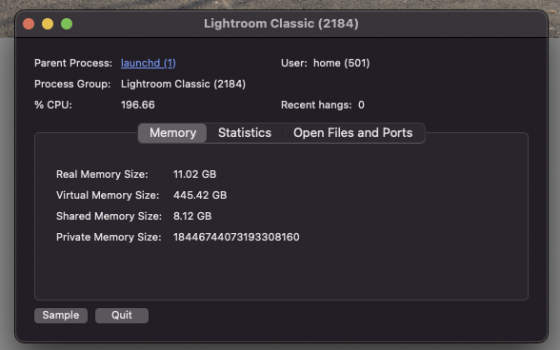
THANK YOU TO @white7561 for pointing out a 445.42 GB memory leak - Anyone know how to figure out what caused it so I can try and get the issue reported / fixed?

Browsing + Zooming in and out of a large Pano in Adobe Lightroom Classic today and already had the system run out of memory.

I didn't think this would happen like ever. It was a large pano 6.37 gb in psb format.

Only other apps open was mail / canary mail / safari / messages / App Store and activity monitor

No standard 1:1 preview was built in LRC but still I would have expected it to handle it especially considering the capabilities of this machine.

Not sure if Adobe have some work to do with LRC or 4 days is not long enough for all new Mac background tasks. How can viewing a 7 gb image cause a machine like this to run out of memory??

Specs are 16" MBP M1 Max w 64 Gb ram - 4 TB SSD - MacOs 12.0.1 and LRC Version 11.0 - Screen attached - LG HDR 4K Display LG 32UN880 32'' 4K Ergo IPS Monitor

Catalogue is only 460 mb with 15k images
 

Attachments

  • Screenshot 2021-10-30 at 15.05.15.png
    Screenshot 2021-10-30 at 15.05.15.png
    79.8 KB · Views: 1,266
  • Screenshot 2021-10-30 at 15.08.41.png
    Screenshot 2021-10-30 at 15.08.41.png
    124.1 KB · Views: 548
  • Screenshot 2021-10-30 at 15.09.28.png
    Screenshot 2021-10-30 at 15.09.28.png
    558 KB · Views: 599
Last edited:

white7561

macrumors 6502a
Jun 28, 2016
934
383
World
Hi @white7561 Thank you for your input 👍 What is a memory leak? Where is it going to? Any ideas what caused it?
Memory Leak is when some process is usually bugging out or glitching and taking so much memory until usually we run out of memory. It could be because of Lightroom or just the interaction between it and Monterey. Because normally that process wouldn't take that much ram
 

Outer_net

macrumors newbie
Original poster
Aug 6, 2021
28
6
Just learnt a little about memory leaks - do you think the cause of this is Adobe software or MacOs or a bit of both?

I know Adobe has just released an update and Monterey is also fresh out of the oven. Any suggestions for troubleshooting steps would be greatly appreciated.
 

Outer_net

macrumors newbie
Original poster
Aug 6, 2021
28
6
My guess is that Apple will pin the issue to Adobe and adobe will either blame Mac OS or do nothing about it !

Is it possible to find out what caused this issue by looking at diagnostic logs?

You would think that with ML and neural cores this would be smart enough to sense the rogue memory leak and fix it - But I guess beyond all the hype / announcements / reviews and PR we are still dealing with the same old. Apple blaming 3rd party App developers and 3rd party app devs blaming Apple or being deaf.

Thank you for your help!
 
Last edited:

white7561

macrumors 6502a
Jun 28, 2016
934
383
World
My guess is that Apple will pin the issue to Adobe and adobe will either blame Mac OS or do nothing about it !

Is it possible to find out what caused this issue by looking at diagnostic logs?

You would think that with ML and neural cores this would be smart enough to sense the rogue memory leak and fix it - But I guess beyond all the hype / announcements / reviews and PR we are still dealing with the same old. Apple blaming 3rd party App developers and 3rd party app devs blaming Apple or being deaf.

Thank you for your help!
Idk for sure. But yeh you could probably report it to adobe to check. Have you ever tried loading this same PSB with that much catalogue in another computer? If you have and it's fine there then it's most likely yeah a memory leak. So far it looks like it but I don't use Lightroom that much. Just once when I need to so I don't know that much on how it handles if the thing it's trying to load will lead to out of memory error etc.

Never heard of it using that much ram tho
 

Outer_net

macrumors newbie
Original poster
Aug 6, 2021
28
6
Hey @Macintosh IIcx and @white7561 thank you both very much for your help!

I had always assumed that if an image is too big you would get a warning on import - like here

havecamerawilltravel.com/lightroom/largest-image-size-import-lightroom

It was a little over the max Megapixel LR limit 512 mp so I have reduced it down now. Not sure why after doing this (and syncing from disk) though there is still such a high Virtual memory size?

Screenshot 2021-10-30 at 22.52.46.png


Before

Screenshot 2021-10-30 at 22.46.36.png


AFTER

Screenshot 2021-10-30 at 22.52.14.png


421.98 Virtual memory size still very high.


Screenshot 2021-10-30 at 23.05.37.png


16.33 GB actual Ram load - much better than 44!

Screenshot 2021-10-30 at 23.05.47.png


Is the virtual memory not supposed to be that high ?

Is there a correlation between actual and virtual memory ?

Maybe it is just the sad truth of Adobe software - still just as 💩 on M1 as it was on intel !

Cheers for your 🧠
 
Last edited:

Outer_net

macrumors newbie
Original poster
Aug 6, 2021
28
6
Post above needs a mod to approve ↑ maybe because of a link or being a newbie?

Just opening Lightroom seems to use around 400 GB of virtual memory!

Screenshot 2021-10-30 at 23.26.23.png


Lightroom > Help > System Info is

Lightroom Classic version: 11.0 [ 202110120910-0bccc70d ]
License: Creative Cloud
Language setting: en-GB
Operating system: Mac OS 12
Version: 12.0.1 [21A559]
Application architecture: arm64
Logical processor count: 10
Processor speed: NA
SqLite Version: 3.36.0
Built-in memory: 65,536.0 MB
Real memory available to Lightroom: 65,536.0 MB
Real memory used by Lightroom: 4,936.7 MB (7.5%)
Virtual memory used by Lightroom: 409,108.9 MB. <<<<<<<<<<<<<<<<<<<<
Memory cache size: 542.5MB
Internal Camera Raw version: 14.0 [ 950 ]
Maximum thread count used by Camera Raw: 5
Camera Raw SIMD optimization: SSE2
Camera Raw virtual memory: 1031MB / 32767MB (3%)
Camera Raw real memory: 1113MB / 65536MB (1%)
Displays: 1) 3840x2160, 2) 3456x2234

Graphics Processor Info:
Metal: Apple M1 Max
 

gtg465x

macrumors 6502a
Sep 12, 2016
754
883
No surprise. Adobe has a rocky track record with supporting new OS updates and platforms well right out of the gate.
 

Outer_net

macrumors newbie
Original poster
Aug 6, 2021
28
6
Looks like a big Adobe issue -
https://www.reddit.com/r/Lightroom/comments/kg4bpm

Its hard to say what is really going on as the second case seems to be Rosetta based and this kind of LRC is Apple.

Maybe macOs is contributing to the issue by allowing too much memory to be allocated? and Adobe is just trying to grab whatever it can?
 

white7561

macrumors 6502a
Jun 28, 2016
934
383
World
Looks like a big Adobe issue -
https://www.reddit.com/r/Lightroom/comments/kg4bpm

Its hard to say what is really going on as the second case seems to be Rosetta based and this kind of LRC is Apple.

Maybe macOs is contributing to the issue by allowing too much memory to be allocated? and Adobe is just trying to grab whatever it can?
I don't know but. Isn't the newest versions are all native apps? No longer using Rosetta?
 

nortonandreev

macrumors 68030
Jan 11, 2016
2,598
3,787
Europe
I’ve been experiencing memory leaks with the latest Monterey betas on my 16” intel MacBook pro, as well as on the new M1 Pro MacBook Pro. It also happens when using stock apps only (like Safari and Music). Monterey has been such a disappointment - no new features, yet released with critical known bugs.
 
  • Like
Reactions: karl-os

altaic

macrumors 6502a
Jan 26, 2004
651
432
Yeah, pretty much every process says 390+GB virtual memory. Think of it as the upper limit of memory a single process can use. Real memory is really what matters, and is where memory leaks are apparent.

I've noticed the Control Center process leaks many (14+) GB over the course of a couple days. Periodically killing it (i.e. quitting it in Activity Monitor) to reset it back to 27 MB is my workaround. I haven't noticed any other egregious leaks, however.

I've got to say, though, I'm pretty shocked that there are any leaks in OS-related processes (not Adobe; that wouldn't surprise me at all). There are so many good tools to detect and locate memory leaks these days... I'd think Apple would have such checks in their continuous integration suite.
 
  • Like
Reactions: 8mrg81 and Wizec

LewisW

macrumors newbie
Nov 3, 2021
1
0
This happened to me twice today using Lightroom on my new 14 inch MacBook Pro. M1 max, 32 core gpu, 64gb ram.
 

Attachments

  • 414C6FD0-24DF-468B-80CD-FFB10A390531.png
    414C6FD0-24DF-468B-80CD-FFB10A390531.png
    153.6 KB · Views: 194

macphoto861

macrumors 6502
May 20, 2021
475
401
This happened to me twice today using Lightroom on my new 14 inch MacBook Pro. M1 max, 32 core gpu, 64gb ram.
I’m curious as to what triggers this. I was running LR Classic 11 today under a pretty extensive workload (simultaneously exporting a few thousand JPEGs in two different sizes, plus editing other images), and memory usage stayed in a normal range of about 7gb-9gb.
 

Krevnik

macrumors 601
Sep 8, 2003
4,100
1,310
Is there a correlation between actual and virtual memory ?

Yes and no. Virtual memory as a feature does provide for a lot addresses that a process can use for things.

Virtual memory usage represents the addresses in use by a process. Real memory is what's actively required by the process at that moment in time. They tend to be correlated, but there are plenty of things that will impact virtual memory usage without impacting real memory usage.

Memory mapped files are a common example. If I have a 2GB file, and I map it into memory, it's given virtual addresses that take up 2GB. But it doesn't use any RAM... yet. Once I try to read a page from that file, it gets loaded into RAM, though. The operating system will memory map executables as a way to lazily load the code to execute. Helps a lot when dealing with large apps like Lightroom or Office, only loading the code for bits that are needed as it goes. But the whole executable exists in the virtual address space at all times.

For some reason I can't fathom, Apple does this with fonts as well. Back in the 32-bit days, I've worked on projects where we exhausted the whole 4GB VM address range because of the abundance of memory mapped files and crashed apps doing that. Whoops.

Yeah, pretty much every process says 390+GB virtual memory. Think of it as the upper limit of memory a single process can use. Real memory is really what matters, and is where memory leaks are apparent.

What the OS reports for process VM is the usage, not the upper limit. 300GB is nuts. Xcode is one of the most VM heavy apps I use, and it is using about 23GB of VM address space on my Big Sur machine.

There are reasons why this number will be something silly like 8-10GB when only 100-500MB is actually allocated and in use. But something doesn't seem right with these numbers that are 1.5 orders of magnitude bigger.
 

altaic

macrumors 6502a
Jan 26, 2004
651
432
What the OS reports for process VM is the usage, not the upper limit. 300GB is nuts. Xcode is one of the most VM heavy apps I use, and it is using about 23GB of VM address space on my Big Sur machine.

There are reasons why this number will be something silly like 8-10GB when only 100-500MB is actually allocated and in use. But something doesn't seem right with these numbers that are 1.5 orders of magnitude bigger.
It does seem bizarre. The whole OS is like 44GB 🤷‍♂️
 

altaic

macrumors 6502a
Jan 26, 2004
651
432
Yes and no. Virtual memory as a feature does provide for a lot addresses that a process can use for things.

Virtual memory usage represents the addresses in use by a process. Real memory is what's actively required by the process at that moment in time. They tend to be correlated, but there are plenty of things that will impact virtual memory usage without impacting real memory usage.

Memory mapped files are a common example. If I have a 2GB file, and I map it into memory, it's given virtual addresses that take up 2GB. But it doesn't use any RAM... yet. Once I try to read a page from that file, it gets loaded into RAM, though. The operating system will memory map executables as a way to lazily load the code to execute. Helps a lot when dealing with large apps like Lightroom or Office, only loading the code for bits that are needed as it goes. But the whole executable exists in the virtual address space at all times.

For some reason I can't fathom, Apple does this with fonts as well. Back in the 32-bit days, I've worked on projects where we exhausted the whole 4GB VM address range because of the abundance of memory mapped files and crashed apps doing that. Whoops.


What the OS reports for process VM is the usage, not the upper limit. 300GB is nuts. Xcode is one of the most VM heavy apps I use, and it is using about 23GB of VM address space on my Big Sur machine.

There are reasons why this number will be something silly like 8-10GB when only 100-500MB is actually allocated and in use. But something doesn't seem right with these numbers that are 1.5 orders of magnitude bigger.
So, I think something is screwy with Activity Monitor. All arm64e processes report 390+GB of virtual memory. So I copied Calculator.app, re-signed it with the entitlement get-task-allow, and ran Instruments to see what was going on.

Initially, I hit a roadblock because the app simply wouldn’t launch, and the logs didn’t show anything useful. So I ran it the x86 section under Rosetta (just check the box in the finder info panel), and Instruments launched it and collected data. IIRC, the total memory allocated (including VM) was around 200MB, yet Activity Monitor was showing around 33GB of VM. Something isn’t right with Activity Monitor.

I still don’t know why I can’t attach to arm64e processes. I’m not going to disable SIP, so I’d like to figure out why it’s failing (or why under Rosetta it works). An hour of searching online turned up similar questions, but no useful workarounds. I do have my system set up for development/debugging and attaching a debugger/instrumentation should work as it does on my Intel system. If anyone has any ideas, I’m all ears.
 

macphoto861

macrumors 6502
May 20, 2021
475
401
Try running Lightroom with GPU acceleration disabled (Lightroom preferences, performance). I found this dramatically reduced LR memory usage (like 75% reduction, after a restart). The RAM is shared with GPU, and LR appears to be hogging GPU RAM.
So that brings about the question of whether or not this is a bug or a "feature". It could be that LR is seeing a bunch of free memory, and saying "well heck, I might as well use this with the GPU to cache image data rather than just letting it sit there unused."
 
Register on MacRumors! This sidebar will go away, and you'll see fewer ads.